Basic measurement issues
- Details
- Last Updated: Sunday, 23 August 2015 10:56
- Written by Dr. Donald H. Mershon
Summary: A discussion of basic measurement units, common to the study of perception, including log and linear scales.
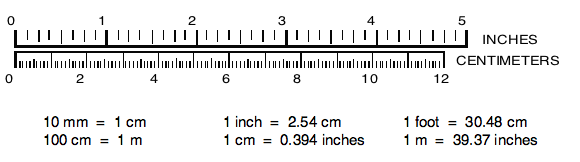
For scientific work, the use of the metric system of measurement is generally preferred to the English system. Units commonly seen in perception research are the millimeter (mm), the centimeter (cm), and the meter (m). A small comparison scale is shown below, along with some equivalents. (Note that although the relative lengths of these scales should be correct, their absolute lengths depend heavily on your particular video display.)
The wavelength of light is also expressed in metric units, either millimicrons (mµ) or nanometers (nm), where 1 mµ = 1 nm = 0.0000001 cm. Sometimes, one sees a unit known as the Ångström (or Å), where 1 Å = 0.1 nm. The major portion of visible light thus falls between 400-700 nm (i.e., between 4000-7000 Å) in wavelength.
Prefixes to indicate overall scale
It is useful to know the basic prefixes that can indicate the overall scale of measurements. According to the International System of Measurement (aka the SI system), for any unit (e.g., a second, a meter), the following modifiers apply as shown: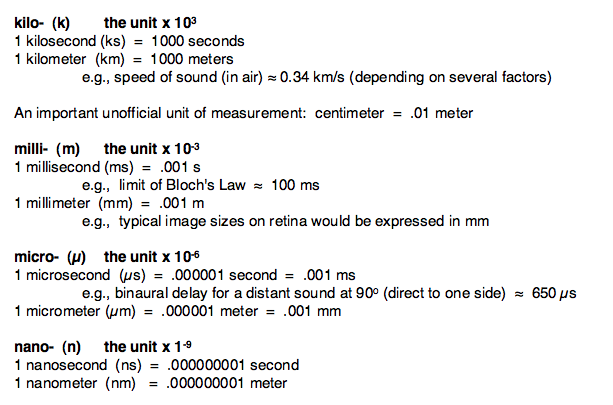
Logarithmic Scales
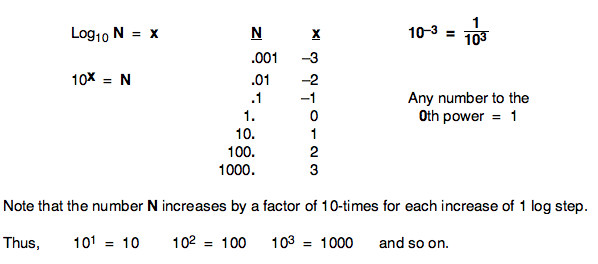
Sensory systems are often capable of handling a very wide range of physical intensities. In order to describe the operation of such systems in an understandable and convenient manner, logarithmic scales are frequently employed in place of linear ones. Although other forms of logarithmic scales exist, the following discussion will consider only logarithms to the base 10, since these are in most common use.
Put simply in words, a logarithm to the base 10, of any number N, is that exponent to which one must raise 10, in order to produce the original number. If we use x to represent the value of the logarithm, then the following relationships are true:
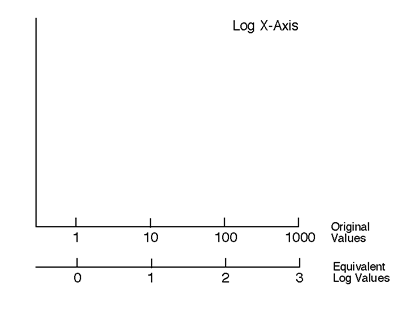
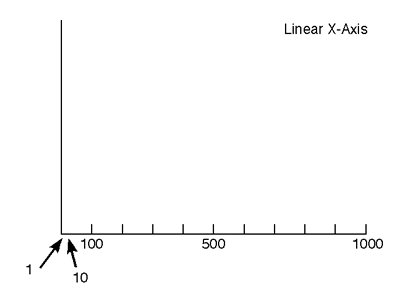
The following graphs demonstrate some of the differences between a linear plot and a log plot. (Double use of the terms "linear" or "log" would indicate that both axes on a particular graph involve the same type of scale, as in a log-log graph.)
A Linear Plot provides coverage of the complete range of values, but may make it difficult to observe effects at the lower end of the range. Equal steps anywhere on a linear axis represent equal linear change; that is, a ten-unit difference involves the same separation, regardless of where the two values are located on the axis).
A Log Plot gives more visibility to small effects, if they occur at the lower end of the range. Log Plots can have axes that reflect the original values, or can be numbered in a way that indicates the equivalent log values. In either case, the spacing is typically logarithmic (i.e., equal steps on an axis represent equal proportional changes).